


An uncomfortable truth about most enterprise AI initiatives is that they fail to justify themselves. MIT’s NANDA initiative, in its report The GenAI Divide: State of AI in Business 2025, found that 95% of enterprise AI pilot programs fail to generate measurable financial returns — a finding based on interviews with company leaders, employee surveys, and analysis of hundreds of public AI deployments. (Fortune coverage)
- Why Traditional ROI Models Fail for Generative AI ROI
- Redefining ROI: From Productivity to Financial Impact
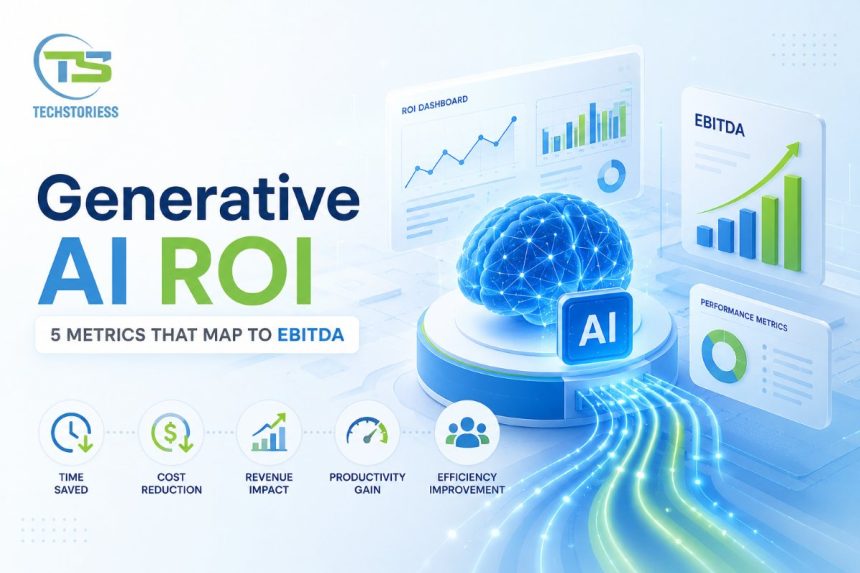
- The 5-Metric Generative AI ROI Scorecard
- Mapping AI Metrics to EBITDA
- Real-World Use Cases: From Theory to Measurable Impact
- Building an AI ROI Tracking Dashboard
- How to Start: A Practical Implementation Approach
- The 2026 Shift: From Experimentation to Accountability
- Conclusion
- FAQ
It is not because of poor model performance, tooling gaps, or even data readiness. The reason is far more fundamental: enterprises do not have a consistent way to measure ROI that aligns with their financial reporting frameworks.
At this point, most organizations stall. While a generative AI pilot may show encouraging outputs like quicker content creation, automated code suggestions, and faster support responses, when the conversation reaches the CFO’s desk, the narrative breaks down. “Productivity gains” fail to cleanly translate into balance sheet impact. To evolve from just an expense into a solid investment, AI needs a defensible framework.
In 2024, experimentation in generative AI adoption accelerated rapidly, and 2025 marked the year of cautious scaling. Now, 2026 is the year of accountability. It has shifted the central concern-from how can AI work? to how to measure EBITDA-aligned generative AI ROI in enterprise environments.
Why Traditional ROI Models Fail for Generative AI ROI
Conventional ROI models were designed for deterministic systems-ERP upgrades, infrastructure modernization, or automation tools with specific, predictable outputs. Generative AI operates differently.
First, it delivers probabilistic outcomes. For instance, a large language model may produce high-quality results most of the time, but precision can vary. Second, rather than being confined to a single function, its value is distributed across workflows. Tools like LLMs simultaneously impact marketing, engineering, customer support, and operations – which makes attribution complex.
More importantly, conventional ROI models assume clear input-output mapping by default. Generative AI, on the other hand, introduces an intermediate layer: human-AI collaboration. If an employee accomplishes a task faster using AI, what portion of that efficiency should be attributed to the model versus the user?
This ambiguity must be resolved to move AI initiatives beyond pilots. McKinsey’s 2025 State of AI survey found that just 39 percent of organizations report any measurable EBIT impact at the enterprise level from AI, even as adoption itself is now widespread. (McKinsey, “The state of AI in 2025”)
Redefining ROI: From Productivity to Financial Impact
The most effective way to address this is to shift from a vague productivity narrative to a structured measurement model grounded in financial outcomes.
Instead of only asking whether AI saved time or effort, enterprises must ask: did AI reduce cost, increase revenue, or improve margins?
This forms the foundation of LLM business value measurement. To justify ROI, every AI output must ultimately map to one of three financial levers:
- Cost reduction
- Revenue expansion
- Risk mitigation (protecting future earnings)
By expressing AI outcomes in these terms, they become meaningful to finance teams.
The 5-Metric Generative AI ROI Scorecard
A finance-team-friendly AI productivity metrics framework provides a practical way to operationalize this shift. Such a framework is a structured scorecard that translates AI activity into measurable business impact.
Cost per Task Reduction
This is the most direct and defensible metric.
Formula:
(Cost per task before AI – Cost per task after AI) × Volume
For instance, if resolving a customer support ticket manually costs ₹120 and AI reduces it to ₹70, the savings become immediately quantifiable. This becomes a powerful operational efficiency lever when implemented at scale.
Output per Employee Increase
Generative AI often augments productivity rather than replacing roles.
Formula:
(Output per employee after AI – baseline output) × employee count
For example, in content teams:
- 3 articles per week → 8 articles per week
The financial impact comes from:
- Reduced hiring needs
- Faster go-to-market cycles
Cycle Time Compression
Time is not just a productivity metric-it is a financial variable.
Formula:
(Time saved per task × task volume) → converted into cost or revenue impact
In engineering environments, faster code generation accelerates release cycles. Gartner’s research on AI in software engineering finds that organizations with higher AI adoption — particularly those applying it across the full development lifecycle rather than just coding — report stronger productivity outcomes. (Gartner, “Don’t Limit AI in Software Engineering to Coding”)
Error and Risk Reduction
AI standardization can significantly reduce costly errors.
Formula:
(Reduction in error rate × cost per error)
In finance, healthcare, or compliance-heavy sectors, even small reductions in error rates translate into substantial savings-both in direct costs and regulatory exposure.
Revenue Influence per Workflow
This is one of the most powerful yet underutilized metrics.
Formula:
(Revenue uplift attributable to AI-assisted workflows)
Examples include:
- AI-driven personalization in marketing
- Faster sales proposal generation
- Improved customer response quality
McKinsey’s research on AI-driven customer engagement found that a “next best experience” engine using AI drove a 5% increase in incremental revenue, a 30% margin impact within a year of launch, and a click-through rate two to three times higher than traditional campaigns. (McKinsey, “Next best experience”)
Mapping AI Metrics to EBITDA
The real breakthrough happens when these metrics are translated into financial language
| AI Metric | Business Impact | EBITDA Mapping |
| Cost per task reduction | Operational efficiency | Direct cost savings |
| Output per employee | Workforce leverage | Reduced hiring / increased margin |
| Cycle time compression | Faster execution | Revenue acceleration |
| Error reduction | Risk mitigation | Lower losses / compliance cost |
| Revenue influence | Growth enablement | Increased top-line contribution |
At this stage, the concept of a generative AI cost savings calculator becomes critical. Instead of abstract reporting, enterprises can develop dynamic financial models to continuously convert operational metrics into financial outcomes.
Real-World Use Cases: From Theory to Measurable Impact
To understand the practical impact, let us picture some real world examples:
Customer Support Automation
Consider a mid-sized SaaS company integrating generative AI into support workflows.
Before AI:
- Average resolution time: 12 minutes
- Cost per ticket: ₹100
After AI:
- Resolution time: 5 minutes
- Cost per ticket: ₹55
With 50,000 tickets per month, the company achieves monthly savings of ₹22.5 lakh, without compromising service quality.
Engineering Productivity
Now consider a product engineering team using AI-assisted coding tools.
Impact:
- 30–40% reduction in coding time
- Faster bug resolution
Instead of hiring additional developers, the company handles increased workload with the same team-improving margins without expanding headcount.
Marketing Content Operations
A digital marketing team uses generative AI to scale content production.
Before AI:
- 10 campaigns per month
After AI:
- 25 campaigns per month
This increase in output leads to measurable outcomes such as higher traffic and improved lead generation.
Here, ROI extends beyond cost savings into revenue amplification-a critical distinction from basic ROI models.
Building an AI ROI Tracking Dashboard
Measuring generative AI ROI is not a one-time process. Enterprises require continuous visibility through an AI ROI tracking dashboard.
A robust dashboard typically includes:
- Baseline vs post-AI performance metrics
- Cost savings trends
- Productivity deltas
- Revenue attribution models
Integration is critical. Data must be aggregated from:
- Workflow tools
- CRM systems
- Financial systems
Without this integration, ROI tracking becomes fragmented and unreliable in enterprise environments.
How to Start: A Practical Implementation Approach
Most organizations overcomplicate ROI measurement. The starting point is simpler.
Identify high-frequency, measurable workflows where AI impact is clearly observable. Establish baseline metrics before introducing AI, then run controlled pilots with defined success criteria.
After validating measurable improvements, expand gradually. Avoid organization-wide rollouts without proven ROI. This phased approach reduces risk while building internal confidence-especially among finance stakeholders.
The 2026 Shift: From Experimentation to Accountability
As enterprise AI enters a new phase, the conversation is moving beyond “what can AI do?” Mature organizations now ask, “what does AI deliver?”
By 2026, we are seeing the emergence of enterprise AI KPIs 2026-standardized metrics that directly link AI performance to business outcomes. Budget approvals increasingly depend on measurable ROI rather than vague innovation narratives.
This shift is reshaping how AI is deployed, evaluated, and scaled. With strong measurement frameworks, organizations can justify investments and identify high-value Enterprise Generative AI Use Cases for faster than competitors.
Conclusion
The failure of most AI initiatives is not due to technology-but measurement.
Without a well-structured, finance-aligned framework, even the most promising AI deployments struggle to move beyond pilot stages. Understanding how to measure generative AI ROI in enterprise workflows is now a defining capability that separates experimentation from execution.
To succeed in this phase, enterprises do not necessarily need the most advanced models. They need something far more practical and essential: a clear, defensible, and repeatable way to connect AI outputs to financial outcomes.
FAQ
How do you calculate ROI on generative AI?
Multiply the cost or time saved per task by task volume, then map that savings to one of three financial levers: cost reduction, revenue expansion, or risk mitigation.
What is a good generative AI ROI metric for enterprises?
Cost-per-task reduction is the most defensible starting metric because it maps directly to a line item finance teams already track.
How does generative AI ROI map to EBITDA?
Each of the five scorecard metrics — cost per task, output per employee, cycle time, error reduction, and revenue influence — maps to either direct cost savings, margin improvement, or top-line contribution.